PowerBI
A PowerBI Custom Visual is available for rendering UpSet.js.
see also Sample PBIX file
Installation#
Download the latest package from https://upset.js.org/integrations/powerbi/upsetjs.pbiviz and install into your PowerBI environment.
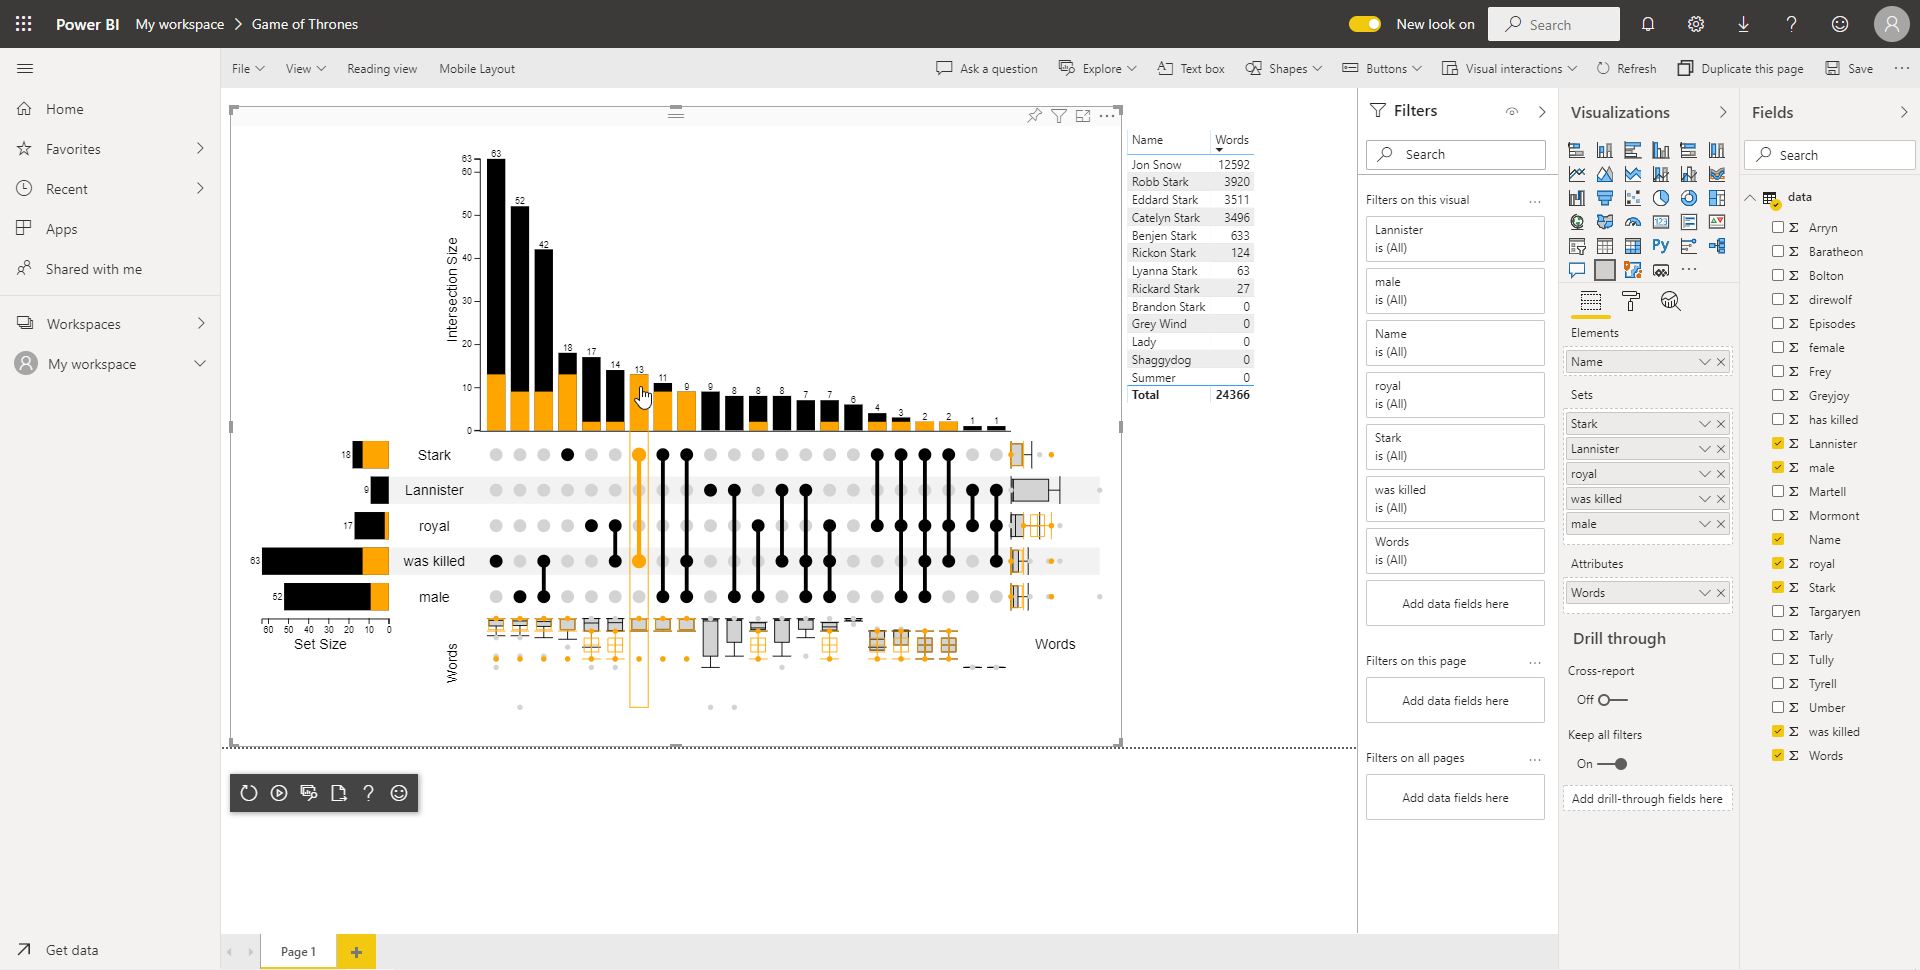
Data Roles#
The UpSet.js visual has three data roles:
Elementsexactly one grouping with a unique identifier for each row (e.g., a name)Setsone or more measures or groupings which represent the sets. When it's value at rowiresults in a trueish value (e.g., 1, true, ...) UpSet.js will interpret it that the element at rowiis part of this setAttributeszero or more numeric measures that are used to generate boxplots for each set intersection
In addition, the visual supports various styling options including the customization of how the set combinations are generated.
Interaction#
The UpSet.js visual reacts to selections from other widgets by highlighting the elements in its chart. Moreover, when the user clicks on an element in the chart, the corresponding set (combination) will be selected.
Venn Diagram#
In addition, there is a sibling extension for rendering Venn and Euler Diagrams:

see also Sample PBIX file