This is a HTMLWidget and Plot.ly Dash wrapper around the JavaScript library UpSet.js and an alternative implementation of UpSetR.
This package is part of the UpSet.js ecosystem located at the main Github Monorepo.
Installation
# CRAN version
install.packages('upsetjs')
# or
devtools::install_url("https://github.com/upsetjs/upsetjs_r/releases/latest/download/upsetjs.tar.gz")

library(upsetjs)
Example
listInput <- list(one = c(1, 2, 3, 5, 7, 8, 11, 12, 13), two = c(1, 2, 4, 5, 10), three = c(1, 5, 6, 7, 8, 9, 10, 12, 13))
upsetjs() %>% fromList(listInput) %>% interactiveChart()
List Input Example
see also UpSetJS.Rmd
Shiny Example
library(shiny)
library(upsetjs)

listInput <- list(one = c(1, 2, 3, 5, 7, 8, 11, 12, 13),
                  two = c(1, 2, 4, 5, 10),
                  three = c(1, 5, 6, 7, 8, 9, 10, 12, 13))

ui <- fluidPage(
  titlePanel("UpSet.js Shiny Example"),
  upsetjsOutput("upsetjs1"),
)

server <- function(input, output, session) {
  # render upsetjs as interactive plot
  output$upsetjs1 <- renderUpsetjs({
    upsetjs() %>% fromList(listInput) %>% interactiveChart()
  })
}

# Run the application
shinyApp(ui = ui, server = server)
shiny
see also Shiny Examples
Dash Example
library(dash)
library(dashHtmlComponents)
library(upsetjs)

app <- Dash$new()

app$layout(
    htmlDiv(
        list(
            htmlH1("Hello UpSet.js + Dash"),
            upsetjsDash(id = "upset") %>% fromList(list(a = c(1, 2, 3), b = c(2, 3)))
                %>% interactiveChart(),
            htmlDiv(id = "output")
        )
    )
)
app$callback(
    output = list(id = "output", property = "children"),
    params = list(input(id = "upset", property = "selection")),
    function(selection) {
        sprintf("You selected \"%s\"", selection$name)
    }
)

app$run_server()
TODO
see also Dash Examples
Venn Diagram
Besides the main UpSet.js plot also Venn Diagrams for up to five sets are supported. It uses the same input formats and has similar functionality in terms of interaction.
listInput <- list(one = c(1, 2, 3, 5, 7, 8, 11, 12, 13), two = c(1, 2, 4, 5, 10), three = c(1, 5, 6, 7, 8, 9, 10, 12, 13))
upsetjsVennDiagram() %>% fromList(listInput) %>% interactiveChart()
image
see also Venn.Rmd
Karnaugh Maps Diagram
Besides the main UpSet.js plot also a variant of a Karnaugh Map is supported. It uses the same input formats and has similar functionality in terms of interaction.
listInput <- list(one = c(1, 2, 3, 5, 7, 8, 11, 12, 13), two = c(1, 2, 4, 5, 10), three = c(1, 5, 6, 7, 8, 9, 10, 12, 13))
upsetjsKarnaughMap() %>% fromList(listInput) %>% interactiveChart()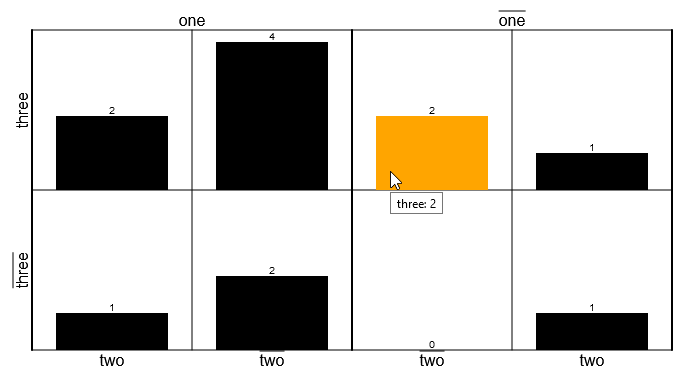
image
see also KMap.Rmd
Dev Environment
requirements:
- R with packages: devtools, pkgdown
- pandoc
Privacy Policy
UpSet.js is a client only library. The library or any of its integrations doesn’t track you or transfers your data to any server. The uploaded data in the app are stored in your browser only using IndexedDB. The Tableau extension can run in a sandbox environment prohibiting any server requests. However, as soon as you export your session within the app to an external service (e.g., Codepen.io) your data will be transferred.
License / Terms of Service
Commercial license
If you want to use UpSet.js for a commercial application or in a commercial environment, the commercial license is the appropriate license. Contact @sgratzl for details.
